How Fast Is The Energy Transition Going? That Depends On Where We Are Headed.

(Originally published at Planetary Technologies, 15 September, 2025.)

With lots of recent chatter about whether the energy transition is slowing down, or not, here is a brief discussion of a couple of relevant charts I haven't yet had time to write up properly. If the globe winds up installing only 10 TW of PV, we are reasonably far into the transition. But if we are on the way to 100 TW, then we are only just getting started, and the world will see installation rates, and thus manufacturing rates, that are as much as 10X higher than what we will have in 2025.

Last year in an installment of The Sun Has Won series (Research Note: Discerning Trends in PV Installation Data PDF), I published a comparison of global historical PV installation amounts with four different scenarios for future installation ranging from 10 TW to 100TW of total generating capacity. The purpose was to provide a means to quantitatively assess how far along we might be towards the equilibrium end state, i.e., the point at which we will have installed all the PV we are going to. Each of the scenarios assumes total PV installation follows a logistic curve, which enables an estimation of the maximum annual rate of installation. (See the PDF for specific methods and justifications, including comments on assuming a sigmoidal trajectory.) Historical installation data is sufficiently variable that is not possible to make an easy judgement about which scenario is most likely. That is,

1) Given variation in annual PV installation data, it is still not possible to distinguish which trajectory we are on.

2) Consequently, we cannot yet judge accurately what the endpoint will be, nor when it will arrive.

From the abstract of the Research Note:

There are at least three different historical price eras for PV, with different market dynamics, and there are today at least four distinct PV markets, with installation rates determined by contrasting local policy priorities. Due to this variability, different models of future market installation that are consistent with historical installation data can produce final installation totals, and maximum installation rates, that span more than an order of magnitude; existing data are consistent with a 2050 installation total of 25–100 TW, and a maximum installation rate of 600 GW to 6 TW per year. In other words, we cannot distinguish between a wide range of outcomes given existing data. Nevertheless, the exercise of comparing models to the historical record can help delineate and constrain the range of our ignorance, which provides a basis for evaluating scenarios for PV installation over the next three decades.

One point above needs further explanation before continuing. There is not a single global market for PV, but rather many different markets, with different installation bases, growth rates, and eventual equilibrium states. Thus lumping all the data into a single annual installation total, and looking at a single cumulative total, can only tell us so much. But it is still a useful exercise, because it informs us about the overall pace of change, which has very practical implications for annual demand and, therefore, for annual investment by, for example, manufacturers, customers, and utilities.

An important feature of this chart is the bottom panel, which compares the annual growth rate in installation to what you would expect for each of the four scenarios. The historical growth rate settled into a small range between 2014 and 2022, before jumping for the next two years. The stable range kept global installation on pace for anywhere between 10 TW and 100 TW, and the 2023 and 2024 rates ran substantially hotter than even the 100 TW pace.

The updated chart below compares the four scenarios with projections from the BloombergNEF (BNEF) Q1 2025 Market Outlook. Notably, BNEF projects a significant deceleration in the global PV installation rate starting next year. (I will just take this on its face value in what follows. Though I will note that for several years running the Market Outlook has forecast a sudden slowdown that has yet to materialize. But don’t judge that too harshly. Due to its customer base, BNEF has an organizational motivation to be conservative and err on the low side. As always, hats off to the BNEF team for gathering — and publishing — the best data set out there.)

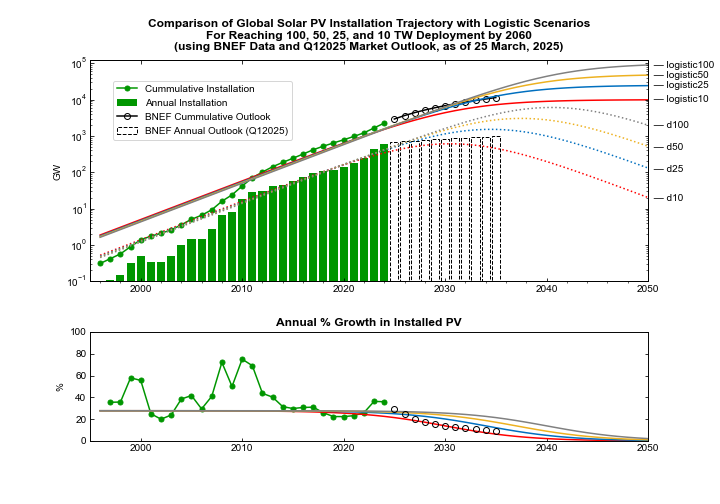
Top panel: Four scenarios for future global PV installation, ranging from 10 TW to 100 TW. Historical data for annual installation (green bars) and cumulative PV capacity (solid green line through data points); the four scenarios for future annual PV installation (dotted lines) and future cumulative capacity (solid lines) are each consistent with historical data. Additionally, the installation forecast from the BNEF Q1 2025 Market Outlook is shown as open boxes with dashed black outline, and the resulting cumulative forecast shown as open black circles. The scenarios are not quantitatively fit to the historical data. Bottom panel: The annual percentage increase in installed PV for the same four scenarios plotted in comparison to historical percentage increases. The percentage increase implicit in the BNEF Q1 202t installation forecast out to 2035 is shown as open black circles (Source: BloombergNEF, Planetary Technologies).

The primary consequence of a sudden deceleration in PV installation would be hewing closer to a much lower final installation total. Similarly, the global annual market for PV would not expand as fast as it has been, and there would be less need for investment in manufacturing capacity. Yet it is unclear, given the economic advantage of PV over all other electricity generation technologies, why installation should decelerate. As I conclude in the aforementioned Research Note:

Given the economic advantage of solar over all other generation sources, particularly when coupled to batteries, it would be more surprising for solar installations to slow down than it would be for solar installations to continue surpassing expectations.

Finally, to try to put the four scenarios in historical context, here is a previously unpublished chart that estimates how far we are along each scenario based on historical data. If we are destined to install only 10 TW, then we are already about 15% of the way there, and a transition to linear growth should happen soon. But if we going to see 100 TW of solar installed by between 2050 and 2060, then we are only 1.5% into the transition, and we should expect to see at least another ten years of exponential growth.

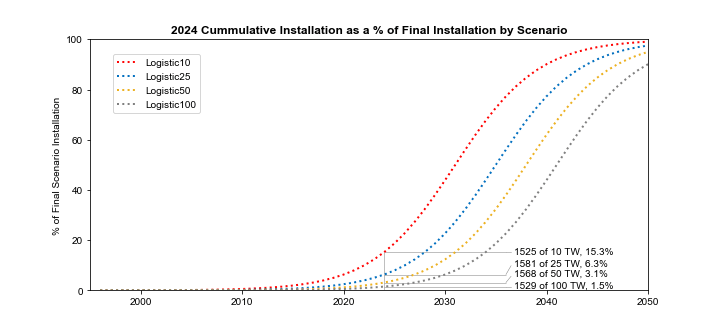
Progress into the energy transmission depends on the end state. As of the end of 2024, we would be ~15% towards an equilibrium state with 10 TW of PV installed, but only ~1.5% towards an equilibrium state with 100 TW installed (Source: Planetary Technologies).

I will finish for now with another quote from the Research Note, which stands as a decent summary of the state of what we can say about how fast we are going, and where we are going, at least until we have several more years of data.

The 10 TW scenario is characterized by a maximum installation rate of 620 GW per year, occurring in 2030, and the 100 TW scenario is characterized by a maximum installation rate of 6 TW per year, in 2040. Notably, by the end of 2022 there was already nearly 1 TW of global manufacturing capacity for modules, although in the first half of 2024 some factories are running at only 40% capacity due to low prices. I estimate that global annual manufacturing capacity today is about 1.5 TW. China by itself is forecast to have 1.7 TW of annual manufacturing capacity by 2026. Given existing and future manufacturing capacity, and given the current volume of warehoused panels, near-term installation rates will not be constrained by supply but rather by other factors, such as installation labor availability, policy, and transmission capacity. Assuming that the real-world installation trajectory will be described by a logistic curve, achieving a 1 TW annual installation rate by 2030 is broadly consistent with a total final installation of between 25 and 100 TW. In the context of aggressive installation policies around the world, with prices unlikely to rise much due to oversupply, it would be bold to predict that installation rates will fall in the immediate future.

High Renewable Electricity Generation is Correlated with Increased Grid Stability

(Originally posted at Planetary Technologies, 13 August, 2025.)

There is currently a great deal of plain misinformation about whether wind and solar electricity generation cause grid instability. Renewable energy skeptics and fossil fuel boosters frequently argue that an increasing reliance on variable wind and solar generation necessarily results in grid instability. These claims are of the inexact, pernicious, type that are easy to make but take significant work to refute. Large scale grid outages are often blamed in initial headlines on renewable energy generation. When investigation determines the cause was elsewhere, including poor performance by fossil fueled generation, inadequate efforts are made to correct fictions in the public record. Analysis is further complicated by a paucity of relevant historical time series data. But where data is available, the correlation is clear.

In reality, data from California and Germany, two of the world’s largest economies, demonstrate empirically that as renewable electricity generation rates increase are correlated with fewer frequency and voltage disruptions. In other words, high renewable energy generation rates are correlated with increased grid stability. These historical trends were evident long before grid-scale batteries became a significant source of electricity on either grid. As batteries provide more capacity to grids around the world, they will enable even larger deployment of renewable generation that will outcompete fossil fueled generation on price and performance.

Germany

In a research note published in 2024 (PDF), we showed that the rise in renewable generation is contemporaneous with 1) an increase in stability of the German grid, 2) an increase in GDP, and 3) a reduction in CO2 equivalent emissions. Below is an updated figure from that publication showing the correlation of grid stability and load supplied by renewables.

Germany reports grid stability data as the number of minutes per year that the grid voltage deviates from the specified operating range. Despite recent major disruptions to both electricity supply and demand, in the form of the pandemic and the war in Ukraine, the German grid has gradually experienced fewer minutes of disruption over the last two decades as the supply of electricity generated by renewables has climbed to reach nearly 60% of demand. The Fraunhofer Institute asserts that this relationship is causative and is attributable to 1) the vast majority of photovoltaic (PV) solar installations in Germany being at the community scale or smaller, and 2) those distributed installations accounting for more than half the total PV-generating capacity in the country. Distributed rooftop and community solar by definition supplies energy in a distributed manner and reduces demand on the larger grid, thereby stabilizing the larger grid. There is no reason to expect this result to be localized to Germany, and, indeed, it is clearly apparent in another large economy.

Figure 1. German national grid interruptions since 2006, share of renewable electricity capacity, and share of renewable electricity generated. (Sources: German Federal Network Agency and Fraunhofer ISE)

California

In California, now the world’s fourth largest economy, the trend is similar; as the renewable electricity supply has grown, the grid has become ever more stable.

The California grid operator, CAISO, reports grid stability as the number Reliability Based Control (RBC) events per month, which occur when the frequency of the grid deviates above or below the standard of 60 Hz. The RBC count has clearly fallen to multi-decadal lows even as renewable electricity generation has approached, and even surpassed, 100% of load.

Figure 2. The CAISO grid has become increasingly stable as wind and solar electricity production has approached 100% of load. (Sources: CAISO and Planetary Technologies)

Spain

The April, 2025, Iberian blackout was quickly blamed on Spain’s increasing dependence on renewable energy, in particular on solar PV. For example, The Financial Times led its initial reporting with the assertion that “The inability of Spain’s electricity grid to manage an unusually high supply of solar power was a key factor in Monday’s catastrophic blackout,” a claim attributed to “some experts”. The article contains further assertions by another supposed expert that “non-controllable resources [such as photovoltaics] . . . don’t contribute to the stability of the internal electrical system”. However, so far as I am aware, there is no data to support such a claim. (And, alas, there is no obvious source of time series data from Spain to examine the correlation of renewable generation with grid stability, as was possible for Germany and California above.)

Two months later, The Financial Times reported that Spanish authorities, after investigating the blackout, had determined that the event was caused by 1) either a fossil-fueled or a nuclear power plant shutting down and 2) the grid operator failing to manage the resulting fluctuations in voltage. The “high supply of solar” was, in fact, not a “key factor” in the blackout. The FT made no particular effort, in the later article or at any time since, to clean up its original misleading reporting.

Spain had temporarily reached 100% renewable (wind, solar, and hydro) generation in the weeks before the blackout, but has minimal grid scale battery storage to either capture excess renewable energy or serve as a buffer for the grid. Large scale energy storage has been dominated by pumped hydro in the country due to policy, but that policy was changed in July to accelerate battery installation. As Spain continues to install solar generation resources, the addition of battery storage will make the grid even more flexible and resilient to failures at unstable fossil-fueled and nuclear power facilities, as batteries have already done elsewhere.

Batteries

The future of electricity grids around the world can be seen emerging in California. Over the course of a day, renewables now provide the majority of the electricity to the grid. Importantly, it isn’t just that renewables provide the majority of electricity during the day, when demand is highest, they also charge batteries during those hours that then displace gas generation during the evening as the sun is setting. As more batteries are installed, more gas will be displaced.

Below are two charts from CAISO’s “Today’s Outlook” page that show the dynamics of the system. On 17 August, at about noon, renewables provided 3.3X as much electricity to the grid as did the combination of gas, hydro, and nuclear, while also charging batteries at a higher rate than the sum of that non-renewable power production. That renewable generation capacity is dominated by flexible and cheap solar PV. For a longer term view, Gridstatus had a nice writeup in June about how batteries and solar are changing all aspects of CAISOs electricity generation and distribution, including dramatically reducing imports.

Figure 3. Supply of electricity, by source, on the CAISO system for the 24 hours of 17, August, 2025. Power generation, and integrated energy supply, was dominated by renewables. (Source: CAISO.)

Figure 4. Power generation in the renewables mix on the CAISO system on 17 August, 2025, was dominated by solar PV. As it now is every day of the year. (Source: CAISO.)

To be sure, 17 August was a nice sunny day across California, but you can use the tool to pick any day you like, and the trend holds. Sure, there is seasonal variation. And yet, every successive year renewables supply a higher percentage of demand. The chart below, from The Sun Has Won: Historical and Planned U.S. Electricity Generation (PDF), from December 2024, shows that solar, in particular, is providing an increasing share of both the maximum and monthly average load. California is gradually weaning itself from both fossil fuels and imports, without needing new nuclear power.

Figure 5. Over the last 10 years, the maximum electricity generation from renewables has climbed to supply more than 100% of load in some months (Sources: CAISO, Planetary Technologies). Note that California excludes conventional large hydroelectric generation from its reporting on “renewables”. Monthly Average Renewables Serving Load was compiled from CAISO Renewables Performance Reports, which comprise a shorter data set than the Maximum Percent of Load. (Sources: CAISO and Planetary Technologies.)

In Germany, battery storage is presently dominated by small scale, home systems, which as of August, 2025 have a net installed capacity approximately 6 times that of large scale systems. This prevalence of distributed storage may contribute to the conclusion that distributed solar is causal for improved grid stability. Total storage capacity growth in Germany hit 50% annually in 2024. However, this is likely to accelerate significantly as large scale battery storage capacity in particular is expected to grow as much as ten-fold over the next two years. Consequently, Germany will serve as another interesting test case for how a country with different renewable resources will store energy and use that storage to meet daily and seasonal variations in demand.

Back in the U.S., as we have written previously (PDF), it is important to keep an eye on what is happening in Texas. The state is installing ever more wind, solar, and battery capacity, and renewables are keeping the grid stable when coal plants are offline. On July 11, 2025, 37% of ERCOT’s coal generating capacity went down for unplanned maintenance, with wind and solar supplying just shy of 50% of demand while keeping the grid up and running. Last year batteries saved the ERCOT grid from crashing twice in two weeks due to unreliable fossil-fueled power plants.

The data, and the anecdotes, are all consistent: more renewable energy generation and storage means more stable grids.

Seeing The End Of Oil

(Originally posted at Planetary Technologies, 04 October, 2019. Written in advance of the 2019 White House Bioeconomy Summit.)

Summary. The end of petroleum is in sight. The reason is simple: the black goo that powered and built the 20th century is now losing economically to other technologies. Petroleum is facing competition at both ends of the barrel, from low value, high volume commodities such as fuel, up through high value, low volume chemicals. Electric vehicles and renewable energy will be the most visible threats to commodity transportation fuel demand in the short term, gradually outcompeting petroleum via both energy efficiency and capital efficiency. Biotechnology will then deliver the coup de grace, first by displacing high value petrochemicals with products that have lower energy and carbon costs, and then by delivering new carbon negative biochemicals and biomaterials that cannot be manufactured easily or economically, if at all, from petrochemical feedstocks.

Bioeconomy Capital is investing to accelerate, and to profit from, the transition away from petroleum to biomanufacturing. We will continue to pursue this strategy beyond the endgame of oil into the coming era when sophisticated biological technologies completely displace petrochemicals, powered by renewable energy and containing only renewable carbon. We place capital with companies that are building critical infrastructure for the 21st century global economy. There is a great foundation to build on.

Biotechnology is already an enormous industry in the U.S., contributing more than 2% of GDP (see “Estimating the biotech sector's contribution to the US economy”; updates on the Bioeconomy Dashboard). The largest component of the sector, industrial biotechnology, comprises materials, enzymes, and tools, with biochemicals alone generating nearly $100B in revenues in 2017 (note that this figure excludes biofuels). That $100B is already between 1/6 and 1/4 of fine chemicals revenues in the U.S., depending on whether you prefer to use data from industrial associations or from the government. In other words, biochemicals are already outcompeting petrochemicals in some categories. That displacement is a clear indication that the global economy is well into shifting away from petrochemicals.

See the Bioeconomy Dashboard for downloadable graphics and additional analysis.

The common pushback to any story about the end of fossil fuels is to assert that nothing can be cheaper than an energy-rich resource that oozes from a hole in the ground. But, as we shall see, that claim is now simply, demonstrably, false for most petroleum production and refining, particularly when you include the capital required to deliver the end use of that petroleum. It is true that raw petroleum is energy rich. But it is also true that it takes a great deal of energy, and a great deal of capital-intensive infrastructure, to process and separate oil into useful components. Those components have quite different economic value depending on their uses. And it is through examining the economics of those different uses that one can see the end of oil coming.

First, let us be clear: the demise of the petroleum industry as we know it will not come suddenly. Oil became a critical energy and materials feedstock for the global economy over more than a century, and oil is not going to disappear overnight. Nor will the transition be smooth. Revenues from oil are today integral to maintaining many national budgets, and thus governments, around the globe. As oil fades away, governments that continue to rely on petroleum revenues will be forced to reduce spending. Those governments have a relatively brief window to diversify their economies away from heavy reliance on oil, for example by investing in domestic development of biotechnology. Without that diversification, some of those governments may fall because they cannot pay their bills. Yet even when oil’s clear decline becomes apparent to everyone, it will linger for many years. Government revenues for low cost producers (e.g., Iran and Saudi Arabia) will last longer than high cost producers (e.g. Brazil and Canada). But the end is coming, and it will be delivered by the interaction of many different technical and economic trends. This post is an outline of how all the parts will come together.

WHAT PRODUCES VALUE IN A BARREL OF OIL? ERGS AND ATOMS

Any analysis of the future of petroleum that purports to make sense of the industry must grapple with two kinds of complexity. Firstly, the industry as a whole is enormously complex, with different economic factors at work in different geographies and subsectors, and with those subsectors in turn relying on a wide variety of technologies and processes. In 2017, The Economist published a useful graphic (below — click through to the original) and story (“The world in a barrel”) that explored this complexity. Moreover, the cost of recovering a barrel and delivering it to market in different countries varies widely, between $10 and $70. Further complicating analysis, those reported cost estimates also vary widely, depending on both the data source and the analyst: here is The Economist, and here is the WSJ, and note that these articles cite the same source data but report quite different costs. The total market value of petroleum products is about $2T per year, a figure that of course varies with the price of crude.

Secondly, “a barrel of oil” is itself complex; that is, barrels are neither the same nor internally homogeneous. Not only are barrels from different wells composed of different spectra of molecules (see the lower left panel above in “Breaking down oil”), but those molecules have very different end uses. Notably, on average, of the approximately 44 gallons per barrel worth of products that are generated during petroleum refining, >90% winds up as heating oil or transportation fuel. Another approximately 5% comprises bitumen and coke. Both of these are are low value; bitumen (aka “tar”) gets put on roads and coke is often combined with coal and burned. In other words, about 42 of the 44 gallons of products from a barrel of oil are applied to roads or burned for the energy (the ergs) they contain.

The other 2% of a barrel, or 1-2 gallons depending on where it comes from, comprise the matter (the atoms) from which we build our world today. This includes plastics precursors, lubricants, solvents, aromatic compounds, and other chemical feedstocks. After being further processed via synthetic chemistry into more complex compounds, these feedstocks wind up as constituents of nearly everything we build and buy. It is widely repeated that chemical products are components of 96% of U.S.-manufactured goods. That small volume fraction of a barrel of oil is thus enormously important for the global economy; just ~2% of the barrel produces ~25% of the final economic value of the original barrel of crude oil, to the tune of more than $650B annually.

CHEAPER ERGS

The big news about the ergs in every barrel is that their utility is coming to an end because the internal combustion engine (ICE) is on its way out. Electric vehicles (EVs) are coming in droves. EVs are far more efficient, and have many fewer parts, than ICE powered vehicles. Consequently, maintenance and operating costs for EVs are signficantly lower than for ICE vehicles. Even a relatively expensive Tesla Model 3 is cheaper to own and operate over 15 years than is a Honda Accord. Madly chasing Tesla into the EV market, and somewhat late to the game, Volkswagen has announced it is getting out of manufacturing ICEs altogether. Daimler will invest no more in ICE engineering and will produce only electric cars in the future. Daimler is also launching an electric semi truck in an effort to compete with Tesla’s forthcoming freight hauler. Not to be left out, VW just announced its own large investment into electic semi trucks. Adding to the trend, last week Amazon ordered 100,000 electric delivery trucks. Mass transit is also shifting to EVs. Bloomberg reported earlier in 2019 that, by the end of this year “a cumulative 270,000 barrels a day of diesel demand will have been displaced by electric buses.” In China total diesel demand is already falling, gasoline demand may well peak this year (see below). Bloomberg points to EVs as the culprit. Finally, as described in a recent report by Mark Lewis at BNP Paribas, the combination of renewable electricity and EVs is already 6-7X more capital efficient than fossil fuels and ICEs at delivering you to your destination; i.e. oil would have to fall to $10-$20/barrel to be competitive.

(Click through image to story.) From “China Is Winning the Race to Dominate Electric Cars”, Nathaniel Bullard, Bloomberg, 20 September, 2019

Consequently, for the ~75% of the average barrel already directly facing competition from cheaper electricity provided by renewables, the transition away from oil is already well underway. Gregor Macdonald covers much of this ground quite well in his short book Oil Fall, as well as in his newsletter. Macdonald also demonstrates that renewable electricity generation is growing much faster than is EV deployment, which puts any electricity supply concerns to rest. We can roll out EVs as fast as we can build them, and anyone who buys and drives one will save money compared to owning and operating a new ICE vehicle. Forbes put it succinctly: “Economics of Electric Vehicles Mean Oil's Days As A Transport Fuel Are Numbered.”

But it isn’t just the liquid transportation fuel use of oil that is at risk, because it isn’t just ergs that generate value from oil. Here is where the interlocking bits of the so-called “integrated petroleum industry” are going to cause financial problems. Recall that each barrel of oil is complex, composed of many different volume fractions, which have different values, and which can only be separated via refining. You cannot pick and choose which volume fraction to pull out of the ground. As described above, a disproportionate fraction of the final value of a barrel of oil is due to petrochemicals. In order to get a hold of the 2% of a barrel that constitutes petrochemical feedstocks, and thereby produce the 25% of total value derived from those compounds, you have to extract and handle the other 98% of the barrel. And if you are making less money off that 98% due to decreased demand, then the cost of production for the 2% increases. It is possible to interconvert some of the components of a barrel via cracking and synthesis, which might enable lower value compounds to become higher value compounds, but it is also quite expensive and energy intensive to do so. Worse for the petroleum industry, natural gas can be converted into several low cost petrochemical feedstocks, adding to the competitive headwinds the oil industry will face over the coming decade. Still, there is a broad swath of economically and technologically important petroleum compounds that currently have no obvious replacement. So the real question that we have to answer is not what might displace the ergs in a barrel of oil — that is obvious and already happening via electrification. The much harder question is: where do we get all the complex compounds — that is, the atoms, in the form of petrochemicals and feedstocks — from which we currently build our complex economy? The answer is biology.

Biochemicals are already competing with petrochemicals in a ~$650B global market.

RENEWABLE ATOMS

Bioeconomy Fund 1 portfolio companies Arzeda, Synthace, and Zymergen have already demonstrated that they can design, construct, and optimize new metabolic pathways to directly manufacture any molecule derived from a barrel of oil. Again, at least 17%, and possibly as much as 25%, of US fine chemicals revenues are already generated by products of biotechnology. To be sure, there is considerable work to do before biotechnology can capture the entire ~$650B petrochemical revenue stack. We have to build lots of organisms, and lots of manufacturing capacity in which to grow those organisms. But scores of start-ups and Fortune 50 companies alike are pursuing this goal. As metabolic engineering and biomanufacturing matures, an increasing number of these companies will succeed.

The attraction is obvious: the prices for high value petrochemicals are in the range of $10 to $1000 per liter. And whereas the marginal cost of production for petroleum products is around $20 billion dollars — the cost of a new refinery — the marginal cost of production for biological production looks like a beer brewery, which comes in at between $100,000 and $10 million, depending on the scale. This points to one of the drivers for adopting biotechnology that isn’t yet on the radar for most analysts and investors: the return on capital for biological production will be much higher than for petroleum products, while the risk will be much lower. This gap in understanding the current and future advantages of biology in chemicals manufacturing shows up in overoptimistic growth predictions all across the petroleum industry.

For example, the IEA recently forecast that petrochemicals will account for the largest share of demand growth for the petroleum industry over the next two decades. But the IEA, and the petroleum industry, are likely to be surprised and disappointed by the performance of petrochemicals. This volume fraction is, as noted above, already being replaced by the products of biotechnology. (Expected demand growth in “Passenger vehicles”, “Freight”, and “Industry”, which uses largely comprise transportation fuel and lubricants, will also be disappointing due to electrification.) We should certainly expect the demand for materials to grow, but Bioeconomy Capital is forecasting that by 2030 the bulk of new chemical supply will be provided by biology, and that by 2040 biochemicals will be outcompeting petrochemicals all across the spectrum. This transition could happen faster, depending on how much investment is directed at accelerating the roll out of biological engineering and manufacturing.

Before moving on, we have to address the role of biofuels in the future economy. Because biofuels are very similar to petroleum both technologically and economically — that is, biofuels are high volume, low margin commodities that are burned at low efficiency — they will generally suffer the same fate, and from the same competition, as petroleum. The probable exception is aviation fuel, and perhaps maritime fuel, which may be hard to replace with batteries and electricity for long haul flights and transoceanic surface shipment.

But this likely fate for biofuels points to the use of those atoms in other ways. As of 2019, approximately 10% of U.S. gasoline consumption is contributed by ethanol, as mandated in the Renewable Fuels Standard. That volume is the equivalent of 4% of a barrel of oil, and it is derived from corn kernels. As ethanol demand falls, those renewably-sourced atoms will be useful as feedstocks for products that displace other components of a barrel of oil. The obvious use for those atoms is in the biological manufacture of chemicals. Based on current yields of corn, and ongoing improvements in using more of each corn plant as feedstock, there are more than enough atoms available today just from U.S. corn harvests, let alone other crops, to displace the entire matter stream from oil now used as petrochemical feedstocks.

BEYOND PETROCHEMISTRY

The economic impact of biochemical manufacturing is thus likely to grow significantly over the next decade. Government and private sector investments have resulted in the capability today to biomanufacture not just every molecule that we now derive from a barrel of petroleum, but, using the extraordinary power of protein engineering and metabolic engineering, to also biomanufacture a wide range of new and desirable molecules that cannot plausibly be made using existing chemical engineering techniques. This story is not simply about sustainability. Instead, the power of biology can be used to imbue products with improved properties. There is enormous economic and technical potential here. The resulting new materials, manufactured using biology, will impact a wide range of industries and products, far beyond what has been traditionally considered the purview of biotechnology.

For example, Arzeda is now scaling up the biomanufacturing of a methacrylate compound that can be used to dramatically improve the properties of plexiglass. This compound has long been known by materials scientists, and long been desired by chemical engineers for its utility in improving such properties as temperature resistance and hardness, but no one could figure out how to make it economically in large quantities. Arzeda's biological engineers combined enzymes from different organisms with enzymes that they themselves designed, and that have never existed before, to produce the compound at scale. This new material will shortly find its way into such products as windshields, impact resistant glass, and aircraft canopies.

Similarly, Zymergen is pursuing remarkable new materials that will transform consumer electronics. Zymergen is developing a set of films and coatings that have a set of properties unachievable through synthetic chemistry and that will be used to produce flexible electronics and displays. These materials simply cannot be made using the existing toolbox of synthetic chemistry; biological engineering gives access to a combination of material properties that cannot be formulated any other way. Biological engineering will bring about a renaissance in materials innovation. Petroleum was the foundation of the technology that built the 20th century. Biology is the technology of the 21st century.

FINANCING RISK

The power and flexibility of biological manufacturing create capabilities that the petroleum industry cannot match. Ultimately, however, the petroleum industry will fade away not because demand for energy and materials suddenly disappears, or because that demand is suddenly met by renewable energy and biological manufacturing. Instead, long before competition to supply ergs and atoms displaces the contents of the barrel, petroleum will die by the hand of finance.

The fact that both ends of the barrel are facing competition from technologically and economically superior alternatives will eventually lead to concerns about oil industry revenues. And that concern will reduce enthusiasm for investment. That investment will falter not because total petroleum volumes see an obvious absolute drop, but rather because the contents of the “marginal barrel” – that is, the next barrel produced – will start to be displaced by electricity and by biology. This is already happening in China and in California, as documented by Bloomberg and by Gregor Macdonald. Thus the first sign of danger for the oil industry is that expected growth will not materialize. Because it is growth prospects that typically keep equities prices high via demand for those equities, no growth will lead to low demand, which will lead to falling stock prices. Eventually, the petroleum industry will fail because it stops making money for investors.

The initial signs of that end are already apparent. In an opinion piece in the LA Times, Jagdeep Singh Bachher, the University of California’s chief investment officer and treasurer, and Richard Sherman, chairman of the UC Board of Regents’ Investments Committee, write that “UC investments are going fossil free. But not exactly for the reasons you may think.” Bachher and Sherman made this decision not based on any story about saving the planet or on reducing carbon emissions. The reason for getting rid of these assets, put simply, is that fossil fuels are no longer a good long-term investment, and that other choices will provide better returns:

We believe hanging on to fossil fuel assets is a financial risk [and that] there are more attractive investment opportunities in new energy sources than in old fossil fuels.

An intriguing case study of perceived value and risk is the 3 year saga of the any-day-now-no-really Saudi Aramco IPO. Among the justifications frequently mooted for the IPO is the need to diversify the country's economy away from oil into industries with a brighter future, including biotechnology, that is, to ameliorate risk:

The listing of the company is at the heart of Prince Mohammed’s ambitious plans to revamp the kingdom’s economy, with tens of billions of dollars urgently needed to fund megaprojects and develop new industries.

There have been a few hiccups with this plan. The challenges that Saudi Aramco is facing in its stock market float are multifold, from physical vulnerability to terrorism, to public perception and industry divestment, through to concerns about the long-term price of oil:

When Saudi Arabia’s officials outlined plans to restore output to maximum capacity after attacks that set two major oil facilities ablaze on Saturday, they were also tasked with convincing the world that the national oil company Saudi Aramco was investable.

The notion that the largest petroleum company in the world might have trouble justifying its IPO, and might have trouble hitting the valuation necessary to raise the cash its current owners are looking for, is eye opening. This uncertainty creates the impression that Aramco may have left it too late. The Company managers may see less value from their assets than they had hoped, precisely because increased financial risk is reducing that value.

And that is the point — each of the factors discussed in this post increases the financing risk for the petroleum industry. Risk increases the cost of capital, and when financiers find better returns elsewhere they rapidly exit the scene. This story will play out for petroleum investments just as it has for coal. Watch what the bankers do; they don’t like to lose money, and the writing is on the wall already. In 2018, global investment in renewable electricity generation was three times larger than the investment in fossil fuel powered generation. Biotechnology already provides at least 17% of chemical industry revenues in the U.S., and is growing in the range of 10-20% annually (see the inset in Figure 2). If you put the pieces together, you can already see the end of oil coming.

DNA Synthesis and Sequencing Costs and Productivity for 2025

In the run up to Synbiobeta25 I decided to update the cost and productivity curves.

Here is the prior update, with a description of what they are, and are not, and of my history in developing them. You can follow the thread backwards for comments on comparisons to Moore’s Law.

I was also asked recently to provide a opinion about the feasibility of the Human Genome Project 2 proposal, which led me to dig into the performance of the Ultima UG100 instrument. I will publish my thoughts on the HGP 2 later.

The UG 100 is a truly impressive instrument, capable of sequencing >30,000 human genomes annually at 30x coverage, with only about an hour of human hands on time to start a sequencing run. The most recent price and productivity sequencing data are based on the UG 100.

As usual, please remember where you found them.

The price per base of DNA sequencing and synthesis — reading and writing DNA — based on price surveys and industry interviews. Until recently, most synthetic genes (the red line) were assembled from short oligonucleotides (oligos) synthesized in large volumes on columns (pink line). Now genes can be readily assembled from oligos synthesized in very small volumes on arrays, though data on the usage and price of array oligos is difficult to pin down; prices for array oligos are asserted to fall in the range from $.00001 to $.001 per base.

The productivity of DNA synthesis and sequencing, measured as bases per person per day, using commercially available instruments, and compared to Moore's Law, which is a proxy for IT productivity. Productivity in sequencing DNA has increased much faster than Moore's Law in recent years. Productivity in synthesizing DNA must certainly have increased substantially for privately developed and assembled synthesizers, but no new synthesis instruments, and no relevant performance figures, have been released since 2008.

Written comments for Artificial Intelligence and Automated Laboratories for Biotechnology: Leveraging Opportunities and Mitigating Risks, 3-4 April, 2024

Here are my written comments for the recent NASEM workshopArtificial Intelligence and Automated Laboratories for Biotechnology: Leveraging Opportunities and Mitigating Risks”, convened at the request of the Congressionally-chartered National Security Commission on Emerging Biotechnology (NCSEB), in April, 2024.

The document is composed of two parts: 1) remarks delivered during the Workshop in response to prompts from NASEM and the National Security Commission for Emerging Biotechnologies and 2) remarks prepared in response to comments arising during the Workshop.

PDF

These comments extend and document my thoughts on the reemergent hallucination that restricting access to DNA synthesis will improve security, and that such regulation will do anything other than constitute perverse incentives that create insecurity. DNA synthesis, and biotechnology more broadly, are examples of a particular kind of distributed and democratized technology. In large markets, served by distributed and accessible production technologies, restrictions on access to those markets and technologies incentivize piracy and create insecurity. There is no data to suggest regulation of such technologies improves security, and here I document numerous examples of counterproductive regulation, including the perverse incentives already created by the 2010 DNA Synthesis Screening Guidelines.

Let’s not repeat this mistake.

Here are a few excerpts:

Biology is a General Purpose Technology. I didn't hear anyone at this meeting use that phrase, but all of our discussions about what we might manufacture using biology, and the range of applications, make clear that we are talking about just such a thing. The Wikipedia entry on GPTs has a pretty good definition: “General-purpose technologies (GPTs) are technologies that can affect an entire economy (usually at a national or global level). GPTs have the potential to drastically alter societies through their impact on pre-existing economic and social structures.” This definitely describes biology. We are already seeing significant economic impacts from biotechnology in the U.S., and we are only just getting started.

My latest estimate is that biotechnology contributed at least $550B to the U.S. economy in 2021, a total that has steadily grown since 1980 at about 10% annually, much faster than the rest of the economy. Moreover, participants in this workshop outlined a future in which various other technologies—hardware, software, and automation, each of which is also recognized as a General Purpose Technology, and each of which contributes significantly to the economy—will be used to enhance our ability to design and manufacture pathways and organisms that will then themselves be used to manufacture other objects.

The U.S. invests in many fields with the recognition that they inform the development of General Purpose Technologies; we expect that photolithography, or control theory, or indeed machine learning, will each have broad impact across the entire economy and social fabric, and so they have. However, in the U.S. investment in biology has been scattershot and application specific, and its output has been poorly monitored. I do have some hope that the recent focus on the bioeconomy, and the creation of various Congressional and Executive Branch bodies, directed to study and secure the bioeconomy, will help. Yet I am on my third White House trying to get the economic impact of biotechnology measured as well as we measure virtually everything else in our economy, and so far the conversation is still about how hard it is to imagine doing this, if only we could first decide how to go about it.

If we in the U.S. were the only ones playing this game, with no outside pressure, perhaps we could take our time and continue fiddling about as we have for the last forty or fifty years. But the global context today is one of multiple stresses from many sources. We must have better biological engineering and manufacturing in order to deal with threats to, and from, nature, whether these are zoonotic pathogens, invasive species, or ecosystems in need of resuscitating, or even rebooting. We face the real threat of engineered organisms or toxins used as weapons by human adversaries. And some of our competitors, countries with a very different perspective on the interaction of the state and political parties with the populace than we have in the U.S., have made very clear that they intend to use biology as a significant, and perhaps the most important, tool in their efforts to dominate the global economy and the politics of the 21st century. So if we want to compete, we need to do better.

In summary, before implementing restrictions on access to DNA synthesis, or lab automation, or machine learning, we must ask what perverse incentives we will create for adaptation and innovation to escape those restrictions. And we must evaluate how perverse incentives may increase risks.

The call to action here is not to do nothing, but rather to be thoughtful about proposed regulation and consider carefully the implications of taking action. I am concerned that we all too frequently embrace the hypothetical security and safety improvements promised by regulation or proscription without considering that we might recapitulate the very real, historically validated, costs of regulation and proscription. Moreover, given the overwhelming historical evidence, those proposing and promoting regulation should explain how this time it will be different, how this time regulation will improve security rather than create insecurity.

Here I will throw down the nitrile gauntlet: would-be regulators frequently get their thinking backwards on regulatory policy. I have heard more than one time the proposition “if you don't propose an alternative, we will regulate this”. But, given prior experience, it is the regulators who must explain how their actions will improve the world, and will increase security, rather than achieve the opposite.1 Put very plainly, it is the regulators' responsibility to not implement policies that make things worse.

1 In conversations in Washington DC I also frequently hear “But Rob, we must do something”. To which I respond: must we? What if every action we contemplate has a greater chance of worsening security than improving it? Dissatisfaction with the status quo is a poor rationale for taking actions that are reasonably expected to be counterproductive. Engaging in security theater that obscures a problem for which we have yet to identify a path forward is no security at all.

DNA Cost and Productivity Data, aka "Carlson Curves"

I have received a number of requests in recent days for my early DNA synthesis and productivity data, so I have decided to post it here for all who are interested. Please remember where you found it.

A bit of history: my efforts to quantify the pace of change in biotech started in the summer of 2000 while I was trying to forecast where the industry was headed. At the time, I was a Research Fellow at the Molecular Sciences Institute (MSI) in Berkeley, and I was working on what became the essay “Open Source Biology and Its Impact on Industry”, originally written in the summer of 2000 for the inaugural Shell/Economist World in 2050 Competition and originally titled “Biological Technology in 2050”. I was trying to conceive of where things were going many decades out, and gathering these numbers seemed like a good way to anchor my thinking. I had the first, very rough, data set by about September of 2000. I presented the curves that summer for the first time to an outside audience in the form of a Global Business Network (GBN) Learning Journey that stopped at MSI to see what we were up to. Among the attendees was Steward Brand, whom I understand soon started referring to the data as “Carlson Curves” in his own presentations. I published the data for the first time in 2003 in a paper with the title “The Pace and Proliferation of Biological Technologies”. Somewhere in there Ray Kurzweil started making reference to the curves, and then a 2006 article in The Economist, “Life 2.0”, brought them to a wider audience and cemented the name. It took me years to get comfortable with “Carlson Curves”, because, even if I did sort it out first, it is just data rather than a law of the universe. But eventually I got it through my thick skull that it is quite good advertising.

The data was very hard to come by when I started. Sequencing was still a labor intensive enterprise, and therefore highly variable in cost, and synthesis was slow, expensive, and relatively rare. I had to call people up to get their rough estimates of how much time and effort they were putting in, and also had to root around in journal articles and technical notes looking for any quantitative data on instrument performance. This was so early in the development of the field that, when I submitted what became the 2003 paper, one of the reviews came back with the criticism that the reviewer – certainly the infamous Reviewer Number 2 – was “unaware of any data suggesting that sequencing is improving exponentially”.

Well, yes, that was the first paper that collected such data.

The review process led to somewhat labored language in the paper asserting the “appearance” of exponential progress when comparing the data to Moore's Law. I also recall showing Freeman Dyson the early data, and he cast a very skeptical eye on the conclusion that there were any exponentials to be written about. The data was, in all fairness, a bit thin at the time. But the trend seemed clear to me, and the paper laid out why I thought the exponential trends would, or would not, continue. Steward Brand, and Drew Endy at the next lab bench over, grokked it all immediately, which lent some comfort that I wasn’t sticking my neck out so very far.

I've written previously about when the comparison with Moore's Law does, and does not, make sense. (Here, here, and here.) Many people choose to ignore the subtleties. I won't belabor the details here, other than to try to succinctly observe that the role of DNA in constructing new objects is, at least for the time being, fundamentally different than that of transistors. For the last forty years, the improved performance of each new generation of chip and electronic device has depended on those objects containing more transistors, and the demand for greater performance has driven an increase in the number of transistors per object. In contrast, the economic value of synthetic DNA is decoupled from the economic value of the object it codes for; in principle you only need one copy of DNA to produce many billions of objects and many billions of dollars in value.

To be sure, prototyping and screening of new molecular circuits requires quite a bit more than one copy of the DNA in question, but once you have your final sequence in hand, your need for additional synthesis for that object goes to zero. And even while the total demand for synthetic DNA has grown over the years, the price per base has on average fallen about as fast; consequently, as best as I can tell, the total dollar value of the industry hasn't grown much over the last ten years. This makes it very difficult to make money in the DNA synthesis business, and may help explain why so many DNA synthesis companies have gone bankrupt or been folded into other operations. Indeed, most of the companies that provided DNA or gene synthesis as a service no longer exist. Due to similar business model challenges it is difficult to sell stand alone synthesis instruments. Thus the productivity data series for synthesis instruments ends several years ago, because it is too difficult to evaluate the performance of proprietary instruments run solely by the remaining service providers. DNA synthesis is likely to remain a difficult business until there is a business model in which the final value of the product, whatever that product is, depends on the actual number of bases synthesized and sold. As I have written before, I think that business model is likely to be DNA data storage. But we shall see.

The business of sequencing, of course, is another matter. It's booming. But as far as the “Carlson Curves” go, I long ago gave up trying to track this on my own, because a few years after the 2003 paper came out the NHGRI started tracking and publishing sequencing costs. Everyone should just use that data. I do.

Finally, a word on cost versus price. For normal, healthy businesses, you expect the price of something to exceed its cost, and for the business to make at least a little bit of money. But when it comes to DNA, especially synthesis, it has always been difficult to determine the true cost because it has turned out that the price per base has frequently been below the cost, thereby leading those businesses to go bankrupt. There are some service operations that are intentionally run at negative margins in order to attract business; that is, they are loss leaders for other services, or in order to maintain sufficient scale so that the company can have access to that scale for its own internal projects. There are a few operations that appear to be priced so that they are at least revenue neutral and don't lose money. Thus there can be a wide range of prices at this point in time, which further complicates sorting out how the technology may be improving and what impact this has on the economics of biotech. Moreover, we might expect the price of synthetic DNA to *increase* occasionally, either because providers can no longer afford to lose money or because competition is reduced. There is no technological determinism here. Just as Moore's Law is ultimately a function of industrial planning and expectations, there is nothing about Carlson Curves that says prices must continuously fall monotonically.

A note on methods and sources: as described in the 2003 paper, this data was generally gathered by calling people up or by extracting what information I could from what little was written down and published at the time. The same is true for later data. The quality of the data is limited primarily by that availability and by how much time I could spend to develop it. I would be perfectly delighted to have someone with more resources build a better data set.

The primary academic references for this work are:

Robert Carlson, “The Pace and Proliferation of Biological Technologies”. Biosecurity and Bioterrorism: Biodefense Strategy, Practice, and Science. Sep, 2003, 203-214. http://doi.org/10.1089/153871303769201851.

Robert Carlson, “The changing economics of DNA synthesis”. Nat Biotechnol 27, 1091–1094 (2009). https://doi.org/10.1038/nbt1209-1091.

Robert Carlson, Biology Is Technology The Promise, Peril, and New Business of Engineering Life, Harvard University Press, 2011. Amazon.

Here are my latest versions of the figures, followed by the data. Updates and commentary are on the Bioeconomy Dashboard.

Creative Commons image licence (Attribution-NoDerivatives 4.0 International (CC BY-ND 4.0)) terms: 

  • Share — copy and redistribute the material in any medium or format for any purpose, even commercially.

  • Attribution — You must give appropriate credit, provide a link to the license, and indicate if changes were made. You may do so in any reasonable manner, but not in any way that suggests the licensor endorses you or your use.

  • NoDerivatives — If you remix, transform, or build upon the material, you may not distribute the modified material.

Here is the cost data (units in [USD per base]):

Year DNA Sequencing Short Oligo (Column) Gene Synthesis
1990 25

1991


1992
1
1993


1994


1995 1 0.75
1996


1997


1998


1999

25
2000 0.25 0.3
2001

12
2002

8
2003 0.05 0.15 4
2004 0.025

2005


2006 0.00075 0.1 1
2007

0.5
2008


2009 8E-06 0.08 0.39
2010 3.17E-06 0.07 0.35
2011 2.3E-06 0.07 0.29
2012 1.6E-06 0.06 0.2
2013 1.6E-06 0.06 0.18
2014 1.6E-06 0.06 0.15
2015 1.6E-09

2016 1.6E-09 0.05 0.03
2017 1.6E-09 0.05 0.02

Here is the productivity data (units in [bases per person per day] and [number of transistors per chip]) — note that commercially available synthesis instruments were not sold new for the decade following 2011, and I have not sat down to figure out the productivity of any of the new boxes that may be for sale as of today:

year Reading DNA Writing DNA Transistors
1971

2250
1972

2500
1974

5000
1978

29000
1982

1.20E+05
1985

2.75E+05
1986 25600

1988

1.18E+06
1990
200
1993

3.10E+06
1994 62400

1996


1997 4.22E+05 15320
1998

7.50E+06
1999 576000
2.40E+07
2000
1.38E+05 4.20E+07
2001


2002


2003

2.20E+08
2004

5.92E+08
2005


2006 10000000

2007 200000000 2500000
2008

2000000000
2009 6000000000

2010 17000000000

2011

2600000000
2012 54000000000

A memorial to Mark Buller, PhD, and our response to the propaganda film "Demon in the Freezer".

Earlier this year my friend and colleague Mark Buller passed away. Mark was a noted virologist and a professor at Saint Louis University. He was struck by a car while riding his bicycle home from the lab, and died from his injuries. Here is Mark's obituary as published by the university.

In 2014 and 2015, Mark and I served as advisors to a WHO scientific working group on synthetic biology and the variola virus (the causative agent of smallpox). In 2016, we wrote the following, previously un-published, response to an "Op-Doc" that appeared in the New York Times. In a forthcoming post I will have more to say about both my experience with the WHO and my thoughts on the recent publication of a synthetic horsepox genome. For now, here is the last version (circa May, 2016) of the response Mark I and wrote to the Op-Doc, published here as my own memorial to Professor Buller.


Variola virus is still needed for the development of smallpox medical countermeasures

On May 17, 2016 Errol Morris presented a short movie entitled “Demon in the Freezer” [note: quite different from the book of the same name by Richard Preston] in the Op-Docs section of the on-line New York Times. The piece purported to present both sides of the long-standing argument over what to do with the remaining laboratory stocks of variola virus, the causative agent of smallpox, which no longer circulates in the human population.

Since 1999, the World Health Organization has on numerous occasions postponed the final destruction of the two variola virus research stocks in Russia and the US in order to support public health related research, including the development of smallpox molecular diagnostics, antivirals, and vaccines.  

“Demon in the Freezer” clearly advocates for destroying the virus. The Op-Doc impugns the motivation of scientists carrying out smallpox research by asking: “If given a free hand, what might they unleash?” The narrative even suggests that some in the US government would like to pursue a nefarious policy goal of “mutually assured destruction with germs”. This portion of the movie is interlaced with irrelevant, hyperbolic images of mushroom clouds. The reality is that in 1969 the US unilaterally renounced the production, storage or use biological weapons for any reason whatsoever, including in response to a biologic attack from another country. The same cannot be said for ISIS and Al-Qaeda. In 1975 the US ratified the 1925 Geneva Protocol banning chemical and biological agents in warfare and became party to the Biological Weapons Convention that emphatically prohibits the use of biological weapons in warfare.

“Demon in the Freezer” is constructed with undeniable flair, but in the end it is a benighted 21st century video incarnation of a middling 1930's political propaganda mural. It was painted with only black and white pigments, rather than a meaningful palette of colors, and using a brush so broad that it blurred any useful detail. Ultimately, and to its discredit, the piece sought to create fear and outrage based on unsubstantiated accusations.

Maintaining live smallpox virus is necessary for ongoing development and improvement of medical countermeasures. The first-generation US smallpox vaccine was produced in domesticated animals, while the second-generation smallpox vaccine was manufactured in sterile bioreactors; both have the potential to cause serious side effects in 10-20% of the population. The third generation smallpox vaccine has an improved safety profile, and causes minimal side effects. Fourth generation vaccine candidates, based on newer, lower cost, technology, will be even safer and some are in preclinical testing. There remains a need to develop rapid field diagnostics and an additional antiviral therapy for smallpox.

Continued vigilance is necessary because it is widely assumed that numerous undeclared stocks of variola virus exist around the world in clandestine laboratories. Moreover, unsecured variola virus stocks are encountered occasionally in strain collections left behind by long-retired researchers, as demonstrated in 2014 with the discovery of 1950s vintage variola virus in a cold room at the NIH. The certain existence of unofficial stocks makes destroying the official stocks an exercise in declaring “victory” merely for political purposes rather than a substantive step towards increasing security. Unfortunately, the threat does not end with undeclared or forgotten samples.

In 2015 a WHO Scientific Working Group on Synthetic Biology and Variola Virus and Smallpox determined that a “skilled laboratory technician or undergraduate student with experience of working with viruses” would be able to generate variola virus from the widely available genomic sequence in “as little as three months”. Importantly, this Working Group concluded that “there will always be the potential to recreate variola virus and therefore the risk of smallpox happening again can never be eradicated.” Thus, the goal of a variola virus-free future, however laudable, is unattainable. This is sobering guidance on a topic that requires sober consideration.

We welcome increased discussions of the risk of infectious disease and of public health preparedness. In the US these topics have too long languished among second (or third) tier national security conversations. The 2014 West Africa Ebola outbreak and the current Congressional debate over funding to counter the Zika virus exemplifies the business-as-usual political approach of throwing half a bucket of water on the nearest burning bush while the surrounding countryside goes up in flames. Lethal infectious diseases are serious public health and global security issues and they deserve serious attention.

The variola virus has killed more humans numerically than any other single cause in history. This pathogen was produced by nature, and it would be the height of arrogance, and very foolish indeed, to assume nothing like it will ever again emerge from the bush to threaten human life and human civilization. Maintenance of variola virus stocks is needed for continued improvement of molecular diagnostics, antivirals, and vaccines. Under no circumstances should we unilaterally cripple those efforts in the face of the most deadly infectious disease ever to plague humans. This is an easy mistake to avoid.

Mark Buller, PhD, was a Professor of Molecular Microbiology & Immunology at Saint Louis University School of Medicine, who passed away on February 24, 2017. Rob Carlson, PhD, is a Principal at the engineering and strategy firm Biodesic and a Managing Director of Bioeconomy Capital.

The authors served as scientific and technical advisors to the 2015 WHO Scientific Working Group on Synthetic Biology and Variola Virus.

Guesstimating the Size of the Global Array Synthesis Market

(Updated, Aug 31, for clarity.)

After chats with a variety of interested parties over the last couple of months, I decided it would be useful to try to sort out how much DNA is synthesized annually on arrays, in part to get a better handle on what sort of capacity it represents for DNA data storage. The publicly available numbers, as usual, are terrible, which is why the title of the post contains the word "guesstimating". Here goes.

First, why is this important? As the DNA synthesis industry grows, and the number of applications expands, new markets are emerging that use that DNA in different ways. Not all that DNA is produced using the same method, and the different methods are characterized by different costs, error rates, lengths, throughput, etc. (The Wikipedia entry on Oligonucleotide Synthesis is actually fairly reasonable, if you want to read more. See also Kosuri and Church, "Large-scale de novo DNA synthesis: technologies and applications".) If we are going to understand the state of the technology, and the economy built on that technology, then we need to be careful about measuring what the technology can do and how much it costs. Once we pin down what the world looks like today, we can start trying to make sensible projections, or even predictions, about the future.

While there is just one basic chemistry used to synthesize oligonucleotides, there are two physical formats that give you two very different products. Oligos synthesized on individual columns, which might be packed into 384 (or more) well plates, can be manipulated as individual sequences. You can use those individual sequences for any number of purposes, and if you want just one sequence at a time (for PCR or hybridization probes, gene therapy, etc), this is probably how you make it. You can build genes from column oligos by combining them pairwise, or in larger numbers, until you get the size construct you want (typically of order a thousand bases, or a kilobase [kB], at which point you start manipulating the kB fragments). I am not going to dwell on gene assembly and error correction strategies here; you can Google that.

The other physical format is array synthesis, in which synthesis takes place on a solid surface consisting of up to a million different addressable features, where light or charge is used to control which sequence is grown on which feature. Typically, all the oligos are removed from the array at once, which results in a mixed pool. You might insert this pool into a longer backbone sequence to construct a library of different genes that code for slightly different protein sequences, in order to screen those proteins for the characteristics you want. Or, if you are ambitious, you might use the entire pool of array oligos to directly assemble larger constructs such as genes. Again, see Google, Codon Devices, Gen9, Twist, etc. More relevant to my purpose here, a pool of array-synthesized oligos can be used as an extremely dense information storage medium. To get a sense of when that might be a viable commercial product, we need to have an idea of the throughput of the industry, and how far away from practical implementation we might be. 

Next, to recap, last year I made a stab at estimating the size of the gene synthesis market. Much of the industry revenue data came from a Frost & Sullivan report, commissioned by Genscript for its IPO prospectus. The report put the 2014 market for synthetic genes at only $137 million, from which I concluded that the total number of bases shipped as genes that year was 4.8 billion, or a bit less than a duplex human genome. Based on my conversations with people in the industry, I conclude that most of those genes were assembled from oligos synthesized on columns, with a modest, but growing, fraction from array oligos. (See "On DNA and Transistors", and preceding posts, for commentary on the gene synthesis industry and its future.)

The Frost & Sullivan report also claims that the 2014 market for single-stranded oligonucleotides was $241 million. The Genscript IPO prospectus does not specify whether this $241 million was from both array- and column-synthesized oligos, or not. But because Genscript only makes and uses column synthesis, I suspect it referred only to that synthesis format.  At ~$0.01 per base (give or take), this gives you about 24 billion bases synthesized on columns sold in 2014. You might wind up paying as much as $0.05 to $0.10 per base, depending on your specifications, which if prevalent would pull down the total global production volume. But I will stick with $0.01 per base for now. If you add the total number of bases sold as genes and the bases sold as oligos, you get to just shy of 30 billion bases (leaving aside for the moment the fact that an unknown fraction of the genes came from oligos synthesized on arrays).

So, now, what about array synthesis? If you search the interwebs for information on the market for array synthesis, you get a mess of consulting and marketing research reports that cost between a few hundred and many thousands of dollars. I find this to be an unhelpful corpus of data and analysis, even when I have the report in hand, because most of the reports are terrible at describing sources and methods. However, as there is no other source of data, I will use a rough average of the market sizes from the abstracts of those reports to get started. Many of the reports claim that in 2016 the global market for oligo synthesis was ~$1.3 billion, and that this market will grow to $2.X billion by 2020 or so. Of the $1.3B 2016 revenues, the abstracts assert that approximately half was split evenly between "equipment and reagents". I will note here that this should already make the reader skeptical of the analyses, because who is selling ~$260M worth of synthesis "equipment"? And who is buying it? Seems fishy. But I can see ~$260M in reagents, in the form of various columns, reagents, and purification kit. This trade, after all, is what keeps outfits like Glenn Research and Trilink in business.

Forging ahead through swampy, uncertain data, that leaves us with ~$650M in raw oligos. Should we say this is inclusive or exclusive of the $241M figure from Frost & Sullivan? I am going to split the difference and call it $500M, since we are already well into hand waving territory by now, anyway. How many bases does this $500M buy?

Array oligos are a lot cheaper than column oligos. Kosuri and Church write that "oligos produced from microarrays are 2–4 orders of magnitude cheaper than column-based oligos, with costs ranging from $0.00001–0.001 per nucleotide, depending on length, scale and platform." Here we stumble a bit, because cost is not the same thing as price. As a consumer, or as someone interested in understanding how actually acquiring a product affects project development, I care about price. Without knowing a lot more about how this cost range is related to price, and the distribution of prices paid to acquire array oligos, it is hard to know what to do with the "cost" range. The simple average cost would be $0.001 per base, but I also happen to know that you can get oligos en masse for less than that. But I do not know what the true average price is. For the sake of expediency, I will call it $0.0001 per base for this exercise.

Combining the revenue estimate and the price gives us about 5E12 bases per year. From there, assuming roughly 100-mer oligos, you get to 5E10 difference sequences. And adding in the number of features per array (between 100,000 and 1M), you get as many as 500,000 arrays run per year, or about 1370 per day. (It is not obvious that you should think of this as 1370 instruments running globally, and after seeing the Agilent oligo synthesis operation a few years ago, I suggest that you not do that.) If the true average price is closer to $0.00001 per base, then you can bump up the preceding numbers by an order of magnitude. But, to be conservative, I won't do that here. Also note that the ~30 billion bases synthesized on columns annually are not even a rounding error on the 5E12 synthesized on arrays.

Aside: None of these calculations delve into the mass (or the number of copies) per synthesized sequence. In principle, of course, you only need one perfect copy of each sequence, whether synthesized on columns or arrays, to use DNA in any just about application (except where you need to drive the equilibrium or reaction kinetics). Column synthesis gives you many more copies (i.e., more mass per sequence) than array synthesis. In principle — ignoring the efficiency of the chemical reactions — you could dial down the feature size on arrays until you were synthesizing just one copy per sequence. But then it would become exceedingly important to keep track of that one copy through successive fluidic operations, which sounds like a quite difficult prospect. So whatever the final form factor, an instrument needs to produce sufficient copies per sequence to be useful, but not so many that resources are wasted on unnecessary redundancy/degeneracy.

Just for shits and giggles, and because array synthesis could be important for assembling the hypothetical synthetic human genome, this all works out to be enough DNA to assemble 833 human duplex genomes per year, or 3 per day, in the absence of any other competing uses, of which there are obviously many. Also if you don't screw up and waste some of the DNA, which is inevitable. Finally, at a density of ~1 bit/base, this is enough to annually store 5 TB of data, or the equivalent of one very beefy laptop hard drive.

And so, if you have access to the entire global supply of single stranded oligonucleotides, and you have an encoding/decoding and sequencing strategy that can handle significant variations in length and high error rates at scale, you can store enough HD movies and TV to capture most of the new, good stuff that HollyBollyWood churns out every year. Unless, of course, you also need to accommodate the tastes and habits of a tween daughter, in which case your storage budget is blown for now and evermore no matter how much capacity you have at hand. Not to mention your wallet. Hey, put down the screen and practice the clarinet already. Or clean up your room! Or go to the dojo! Yeesh! Kids these days! So many exclamations!

Where was I?

Now that we have some rough numbers in hand, we can try to say something about the future. Based on my experience working on the Microsoft/UW DNA data storage project, I have become convinced that this technology is coming, and it will be based on massive increases in the supply of synthetic DNA. To compete with an existing tape drive (see the last few 'graphs of this post), able to read and write ~2 Gbits a second, a putative DNA drive would need to be able to read and write ~2 GBases per second, or ~183 Pbits/day, or the equivalent of ~10,000 human genomes a day — per instrument/device. Based on the guesstimate above, which gave a global throughput of just 3 human genomes per day, we are waaaay below that goal.

To be sure, there is probably some demand for a DNA storage technology that can work at lower throughputs: long term cold storage, government archives, film archives, etc. I suspect, however, that the many advantages of DNA data storage will attract an increasing share of the broader archival market once the basic technology is demonstrated on the market. I also suspect that developing the necessary instrumentation will require moving away from the existing chemistry to something new and different, perhaps enzymatically controlled synthesis, perhaps even with the aid of the still hypothetical DNA "synthase", which I first wrote about 17 years ago.

In any event, based on the limited numbers available today, it seems likely that the current oligo array industry has a long way to go before it can supply meaningful amounts of DNA for storage. It will be interesting to see how this all evolves.